July 13, 2023

Building an Effective Monitoring Stack for Docker Containers: Exploring Grafana, Prometheus, and cAdvisor

INTRODUCTION: 

In this blog post, we will delve into the world of container monitoring and explore the essential components of building a robust monitoring stack for Docker containers. Our focus will be on the Grafana Monitoring Stack, a powerful combination of tools and techniques that enable us to gain deep insights into our containerized applications' performance, health, and security. By the end of this article, you'll have the knowledge and tools necessary to ensure the stability and optimal performance of your Dockerized environments.

To accomplish this, we will concentrate on three key tools: Grafana, Prometheus, and cAdvisor. When combined, these tools offer a complete and scalable solution for monitoring Docker containers.

Grafana, an open-source visualization and analytics platform, plays a pivotal role in our monitoring stack. It empowers us to create customizable dashboards, allowing us to monitor and analyze data from various sources effortlessly.

Prometheus, another open-source tool, excels at collecting and storing time-series data. With its powerful monitoring and alerting capabilities, Prometheus enables us to effectively track and respond to changes in our containerized environments.

Completing our monitoring stack is cAdvisor (Container Advisor), an open-source tool developed by Google that provides detailed insights into individual containers' resource usage and performance characteristics. By leveraging cAdvisor, we can closely monitor container-level metrics and diagnose any potential bottlenecks or issues.

Through the combination of Grafana, Prometheus, and cAdvisor, we can establish a comprehensive monitoring solution that empowers us to make informed decisions and ensure the smooth operation of our containerized applications.

PROBLEM STATEMENT:

As we delve into the implementation of this monitoring stack, it is crucial to understand the challenges that necessitate its adoption. Let's examine some of the key difficulties I encountered when monitoring Docker containers: 

  1. Lack of Visibility: Docker containers introduce an additional layer of abstraction, making it challenging to gain comprehensive visibility into the health and performance of individual containers. This lack of visibility hinders effective monitoring and can lead to difficulties in identifying and resolving issues promptly. 
  2. Resource Bottlenecks: Without proper monitoring, it becomes challenging to identify resource bottlenecks within the Docker environment. This can result in degraded application performance, response time delays, and even container crashes. Effective monitoring is essential to detect and address these bottlenecks proactively.
  3. Reactive Troubleshooting: Relying solely on reactive troubleshooting can be time-consuming and disruptive. Reactively addressing issues can lead to performance degradation and security breaches in the Docker environment. A proactive monitoring approach is crucial for early detection and timely resolution of problems.
  4. Security and Compliance: Monitoring Docker containers goes beyond performance optimization; it is also vital for ensuring the security and compliance of your applications. Effective monitoring helps detect vulnerabilities, unauthorized access attempts, and adherence to compliance standards, safeguarding your Docker environment. 

SOLUTION:

By implementing a monitoring stack with Grafana, Prometheus, and cAdvisor, we can overcome the challenges mentioned earlier and gain comprehensive insights into our Docker containers. 


Installing Grafana:  

1. Prepare the RHEL (Linux) Operating System with the latest packages. Ensure Docker and Docker Compose are pre-installed for this setup. 

2. Create a directory for Grafana configuration: mkdir grafana

3. Navigate to the directory: cd grafana

4. Create a file named docker-compose.yml and open it for editing: nano docker-compose.yml

5. Paste the following contents into the file:
version: '3'
services:
  grafana:
    image: grafana/grafana-enterprise
    container_name: grafana
    restart: unless-stopped
    ports:
      - '3000:3000'
    volumes:
      - 'grafana_storage:/var/lib/grafana'
volumes:
  grafana_storage: {}

6. Save the file and Start the Grafana container: docker-compose up -d

7. Access Grafana in your web browser using the server's IP address or domain name and port 3000 (e.g., http://your-server-ip:3000).


8. Create a new dashboard and set up the desired metrics and alerts for your Docker containers. This requires the installation of Prometheus and cAdvisor. 


Installing Prometheus:  

1. Create a directory for Prometheus configuration: mkdir prometheus

2. Navigate to the directory: cd prometheus

3. Create a file named docker-compose.yml and open it for editing: nano docker-compose.yml. Paste the following contents into that file:
version: '3'
services:
  prometheus:
    image: prom/prometheus
    ports:
      - 9090:9090
    volumes:
      - ./prometheus.yml:/etc/prometheus/prometheus.yml
      - ./data:/prometheus

4. Create another file named prometheus.yml and open it for editing: nano prometheus.yml. Paste the following contents into that file:
global:
  scrape_interval: 15s
scrape_configs:
  - job_name: 'prometheus'
    static_configs:
      - targets: ['localhost:9090']

5. Once we have saved both the above YAML files, we will create a Prometheus service file for RHEL (Red Hat Enterprise Linux) operating system. The below contents should be pasted in the service file and saved in /etc/systemd/system/prometheus.service location. 
[Unit]
Description=Prometheus Server
Documentation=https://prometheus.io/docs/introduction/overview/
After=network.target

[Service]
User=prometheus
Group=prometheus
Type=simple
ExecStart=/usr/local/bin/prometheus --config.file=/etc/prometheus/prometheus.yml --storage.tsdb.path=/var/lib/prometheus/data
ExecReload=/bin/kill -HUP $MAINPID
Restart=always

[Install]
WantedBy=multi-user.target

6. Once we have these files in place, we will start the Prometheus container: docker-compose up -d, and we will execute the below commands for the changes to take effect. 

sudo systemctl daemon-reload          # Reload systemd after modifying the service file
sudo systemctl start prometheus       # Start Prometheus service
sudo systemctl enable prometheus      # Enable Prometheus to start on boot
sudo systemctl status prometheus      # Check the status of Prometheus service

7. The status command will give the active indicator in green. 


8. Verify that Prometheus is running by accessing the Prometheus UI. Open a web browser and visit http://<your_server_ip>:9090. We should see the Prometheus UI, indicating that Prometheus is up and running.


Installing cAdvisor: 

1. Use the following docker command to install and configure cAdvisor:
docker run \
--volume=/:/rootfs:ro \
--volume=/var/run:/var/run:rw \
--volume=/sys:/sys:ro \
--volume=/var/lib/docker/:/var/lib/docker:ro \
--volume=/dev/disk/:/dev/disk:ro \
--device=/dev/kmsg \
--publish=8080:8080 \
--detach=true \
--name=cadvisor \
google/cadvisor:latest

Running the above command will launch cAdvisor as a Docker container in a detached mode with port as 8080. 

2. Verify that cAdvisor is running by accessing the cAdvisor UI. Open a web browser and visit http://<your_server_ip>:8080. We should see the cAdvisor UI, indicating that cAdvisor is up and running.


Integrating Grafana, Prometheus and cAdvisor to make them work as an effective Monitoring Stack: 

1. In Grafana, add Prometheus as a data source using the URL where Prometheus is running, because of which the monitoring of Docker containers can start effectively. 

2. For adding this, Navigate to Home > Connections > Data sources > Prometheus. Once added, we will have it in the list of data sources. 

3. Then, we need to import pre-built Grafana dashboards for Docker and cAdvisor metrics from the Grafana community and create a custom dashboard based on our monitoring needs, which for me included the memory usage, CPU usage, Network I/O and container counts. Below are the default data sources that need to be imported. 

4. So, once we have the data sources sorted and cAdvisor running alongside Prometheus as configured in the above steps, we will have a custom dashboard with all the live information with a refresh interval of 5 seconds to 60 minutes, which can be customized based on requirements. 

5. Below are the dashboard details for different live information received from Docker containers, where each line color represents a different container.

Memory usage per container: 

CPU Usage per container: 

Network I/O per container: 


6. Now we have the monitoring stack setup complete, we can also configure alerts via Alert Manager with this Grafana Web UI. Alert Manager is an open-source component that handles and manages alerts generated by Prometheus. It provides advanced features for deduplicating, grouping, and routing alerts to different receivers, such as email, PagerDuty, or other custom integrations. 

CONCLUSION:

In conclusion, implementing a monitoring stack consisting of Grafana, Prometheus, and cAdvisor for Docker containers is crucial for ensuring the stability and performance of our applications. This powerful combination allows us to gain comprehensive visibility into resource utilization, track performance metrics, and set up proactive alerts for potential issues. Hope this helps!


If you have any questions you can reach out our SharePoint Consulting team here.

June 29, 2023

Excel File Creation: Copying Header Structure from Existing Files


Introduction:

In this blog, we will learn how to create an Excel file based on the structure of an existing Excel file, without content, using Power Automate Flow. We will create a flow that generates a new Excel file inheriting the header structure from the parent file. Regardless of the number of columns or the specific headers in the parent Excel file, our automated flow will replicate the same column names and structure in the new Excel file.

Problem:

We encountered a scenario where we needed to create a separate Excel file with only the header structure from an existing file containing data. Unfortunately, Power Automate's Excel connector does not provide an out-of-the-box action to duplicate or copy a file structure.


Solution:

To address this challenge, we have developed a Power Automate flow that operates on an Excel file and generates another Excel file with only the header structure. These steps are applicable to any type of Excel file, regardless of the header structure. Hence, we can pass a dynamic header structure to the output file. Let's dive into the steps to achieve this:


Step 1:

First, we add the "For a selected file" trigger to initiate our flow. This trigger allows us to activate the flow when a specific file or item is selected within a SharePoint list or library.                               


Step 2:

In this step, we use the "Get table" action to fetch the table name from the existing parent Excel file. By using an expression to retrieve the file name dynamically, we ensure that the "Get table" action fetches the table name from the correct parent Excel file.                        


Step 3:

Next, we include the "List rows present in a table" action to fetch all the data from the Excel table. This action retrieves all the rows present within the specified table in the Excel file. We can dynamically set the "Table" value by retrieving the 'id' value from the first table obtained in the response of the "Get tables" action.

 first(outputs('Get_tables')?['body/value'])['id']  


Step 4:

We will add the "Compose" action and include the following expression:

 first(outputs('List_rows_present_in_a_table')?['body/value'])['id']  

This expression retrieves the first row of data from the output of the "List rows present in a table" action. By capturing the data from the first row using this expression within the "Compose" action, we store it for further processing.


Step 5:

Once we have obtained the output from the "Compose" action, we notice that it includes some unwanted properties such as "@odata.etag" and "ItemInternalId" above the actual data rows. To extract only the column names from the JSON object, we need to remove these unwanted properties.                                


To achieve this, we use the "Select" function, which allows us to manipulate the JSON object and filter out the unwanted properties to easily extract the desired column names.

The "From" value should be set to the following expression:

 json(replace(string(outputs('Compose_5')), '@odata.', 'odata'))  

Insert the following expression as the input value:

 removeProperty(removeProperty(item(), 'ItemInternalId'), 'odataetag')  

This expression removes the "ItemInternalId" and "odataetag" properties from each item in the JSON array.                                 


This is how we have obtained the desired outcomes using this select action:                              


Step 6:

Clicking on the "Next step" button, we choose the "Create CSV file" action. In the "From" field of the "Create CSV file" action, we add the output of the previous "Select" action. This ensures that we capture the modified JSON object with the desired column names and associated values.                            


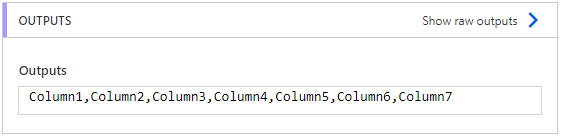
Here, this is the expected output that we have obtained from the above action:                            

Step 7:

In this step, we utilize the "Compose" action to process the CSV table created in the previous step. Add the following expression in the "Inputs" field of the "Compose" action:

 first(split(body('Create_CSV_table'), decodeUriComponent('%0D%0A')))  

This expression splits the body of the "Create_CSV_table" action by the line break ("%0D%0A") and retrieves the first element. This allows us to isolate the header row of the CSV file, which consists of the column names. This allows us to isolate the header row of the CSV file, which consists of the column names.


Here, we have obtained the desired output, which includes the column names that will be utilized in our "Create table" action.


Step 8:

We add the "Create file" action to generate a blank Excel file. In the "File content" field of the "Create file" action, we enter a space to create a blank file.


Step 9:

To create a table in the blank Excel file and include the column names from the "Compose" action in Step 7, we follow these steps:

In the "Column names" field of the "Create table" action, we enter the output of the "Compose" action from Step 7, which is "Compose 6".

By including the column names from the "Compose" action, we ensure that the table created in the Excel file will have the correct column headers.


Finally, we save and run the flow manually. You can see the flow generating a new Excel file with the exact same table structure as the parent file.


Conclusion:

This blog presented a straightforward method to dynamically create a new Excel file with the same header structure as the parent table, without any data. By leveraging Power Automate Flow and SharePoint, we achieved this outcome seamlessly.

If you have any questions you can reach out our SharePoint Consulting team here.

June 22, 2023

Step-by-Step Guide: Unlocking the Power of AI with Azure OpenAI for Custom Data Models

Introduction:

OpenAI has revolutionized the world, prompting many individuals to seek its integration into their own data models. However, concerns regarding data privacy, security, and governance have arisen when utilizing OpenAI models. These considerations hold paramount importance in ensuring the responsible use of AI technologies.

Thankfully, there is a solution: Azure OpenAI Cognitive Services. Microsoft has introduced Azure OpenAI, which enables the deployment of OpenAI models for customized applications while benefiting from the robust security and governance measures provided by Microsoft.

In this article, we will explore the utilization of Azure OpenAI Services to access the ChatGPT model (gpt-3.5-turbo) and leverage Azure Cognitive Search for efficient data indexing and retrieval. Through these technologies, we will demonstrate how to create ChatGPT-like experiences using custom data, all while upholding the necessary privacy, security, and governance protocols.


Prerequisites:

  1. Access to OpenAI Service on Azure
     - Please note that access to Azure OpenAI is currently limited. If your tenant doesn't have access, you can apply for it here.
  2. Your Azure Account must have the necessary permissions, such as Microsoft.Authorization/roleAssignments/write operation permissions (E.g., User Access Administrator or Owner). 
  3. Azure Developer CLI
  4. Python 3+
     - Make sure you can run python --version from the console.

  5. Node.js
  6. Git
  7. PowerShell 7+ (pwsh)
     - Verify that you can run "pwsh.exe" from a PowerShell command. If this fails, it's likely that you need to upgrade your PowerShell version.

Installation:

To install and set up the necessary components, follow these steps:
  1. Create a new folder and open it in the Command Prompt.
  2. Run the command "azd auth login". This will open a browser window for authentication. Enter your Azure credentials in the browser window.
     - 
    Note: Once the authentication is complete, you can close the browser window.
  3. You should see a message like "Logged in to Azure" in the terminal window, indicating a successful authentication:

  4. Run the command "azd init -t azure-search-openai-demo". This command will initialize a git repository.
  5. When prompted for a new environment name, you can either keep the default name or change it as needed. Press Enter to keep the default name.
  6. After this step, you will see a message like "SUCCESS: New project initialized!":


You have now completed the installation and initialization process.

Custom Data Files:

To incorporate your own custom data files (such as PDFs, Word Documents, etc.) into your data models, follow these steps:
  1. Navigate to the folder where the project is initialized. Inside this folder, you will find a directory called "data".

  2. Access the "data" folder and you will find sample data files already present. You can replace or copy your own files into this folder.

Ensure that your custom files are placed within this "data" folder for the project to access and utilize them effectively.

Azure Deployment:

Now that everything is set up locally, we can proceed with deploying the project on Azure. Follow the steps below:

  1. Open the terminal.
  2. Run the command "azd up".
  3. Select the appropriate subscription and press Enter:

  4. Choose the desired region for deployment. Note that the regions currently supporting the models used in this sample are East US or South Central US. For an up-to-date list of regions and models, you can refer to the documentation here.

  5. The deployment process will begin, which includes packaging up the services and deploying them to Azure. Please be patient as this process may take some time.
  6. Once the deployment is complete, you will see a message in the terminal similar to:

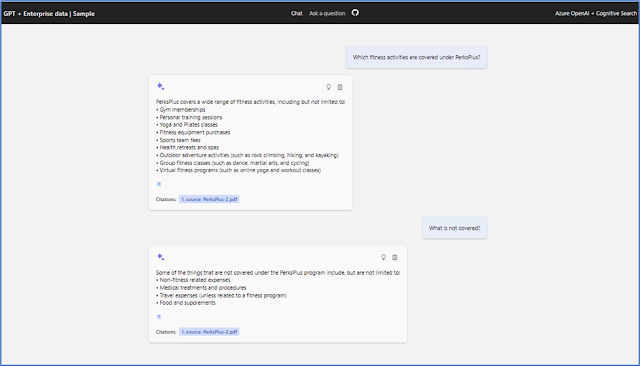
Additionally, you will be provided with an endpoint. Opening this endpoint in a browser will take you to the ChatGPT experience, where you can ask questions to the AI, and it will respond using the custom data files as the source of information and models.

Congratulations! Your application is now deployed on Azure and ready to be accessed via the provided endpoint.

Reference:

Conclusion:

Azure OpenAI Cognitive Services provides a secure and efficient solution for integrating OpenAI models into custom data models. With the power of Azure Cognitive Search and Microsoft's robust security measures, organizations can deploy ChatGPT-like experiences over custom data while ensuring data privacy and governance. By leveraging Azure OpenAI, businesses can unlock the potential of AI technologies and create innovative applications with confidence.

If you have any questions you can reach out our SharePoint Consulting team here.