Overview:
In this article, I'll walk through on how we can measure performance of Power Query Report using the Diagnose Tool in Power BI. Microsoft has just launched this new feature in Power BI - December 2019 update.
Real-Life Use-case and Scenario:
There are the scenarios or requirements where we need to apply many operations (e.g., Change the data types, Create calculated columns, Perform some M functions etc.) within Power Query Editor.
Sometime, the performed operations take time to load
the data, resulting degradation in performance.
To improve the performance, we need to identify which part of the query is taking higher amount of time. Based on that analysis, we can enhance the formula to improve Power
Query performance.
So, let’s see how we can achieve this!!
Step 1:
Please make sure that Power BI Desktop is updated with the latest version (December 2019 or later).
In Power BI Desktop tool, From File, select Options and Settings and click on Options.
This will open a Preview Feature. Make sure that the feature - "Query Diagnostics" is activated.
Step 2:
Open the Power BI report for which we are facing performance issue.
Open the Power BI report for which we are facing performance issue.
From Home, select Transform data. This will open the Query
Editor window.
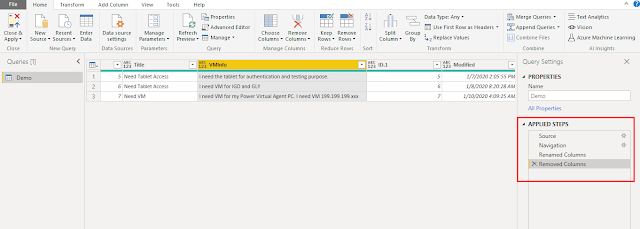
Here, we have four steps in our query editor
window.
Now, let’s check which step is taking more time to execute.
Step 3:
Go to Tools Menu. We have following 2 Group Options here.
- Step Diagnostics
- Session Diagnostics
Step Diagnostics:
Here, we can measure the performance of an individual step.
Suppose, if our Power Query has 15 steps and we only wish to measure the performance
of step #12, at that time this one is best suitable option.
Session Diagnostics:
With this option, we can measure the performance of the entire
report covering all the steps of Power Query.
Here, we will perform both the actions and try to analyze
the data.
Step 4:
Let’s first perform “Session Diagnostics”.
Click on “Start Diagnostics”.
Now, Click on Refresh All data.
Once data is refreshed, click on “Stop Diagnostics”.
Step 5:
When we stop diagnostics, this will add two new tables as a
part of Query Diagnostics.
One represents Overall diagnostics and the other represents Detailed
diagnostics. Let’s click on detailed diagnostics.
Here, we can see all the steps listed with the time
taken for each execution.
From the result, we can easily find out which step is taking the
more time.
Also, if we have used any calculated column or condition-based formula, this will also show how much time is taken by that process.
Step 6:
Let’s say if we wish to measure the performance of the
specific step, then select the appropriate step from the Query Window, then click Diagnostic Step.
This will add following step(s) which will represent the
diagnostics data.
Conclusion:
This is how, we can easily measure the performance of Power
Query. Isn’t it amazing?
Happy Reporting!!
If you have any questions you can reach out our SharePoint Consulting team here.


No comments:
Post a Comment